|
Distributions of measured values
The plots that follow have these widths of bins (horizontal resolutions):
0.1 m/s for the wind speed,
2 arc degrees for the wind direction,
0.5 °C for the air temperature,
0.5 hPa for the atmospheric pressure, and
0.5 % for the relative humidity.
The numbers shown (plus the few outside the figure frames) in each of
the five plots sum up to 22114598, i.e, the number of records accepted
as 'good'.
 |
 |
 |
The wind distributions exhibit two peculiarities. One is a 'bump',
a secondary mode at about 1 m/s in the velocity distribution,
and the other is a wavy pattern in the angular distribution. To check
if the two features come from the same source we have inspected
the angular distrubution of winds belonging to the bump, i.e.
with speeds smaller than 1.3 m/s. Such a distribution does not
contain the wavy patters. In fact it is only marginally visible
in winds slower than the modal value of 3.2 m/s (see the second
diagram below), so responsible seem to be the stronger winds.
Noteworthy, this wavy structure in the angular
distribution is present in about equal measure in older data and
more recent data, thus it is not due to any aging effect.
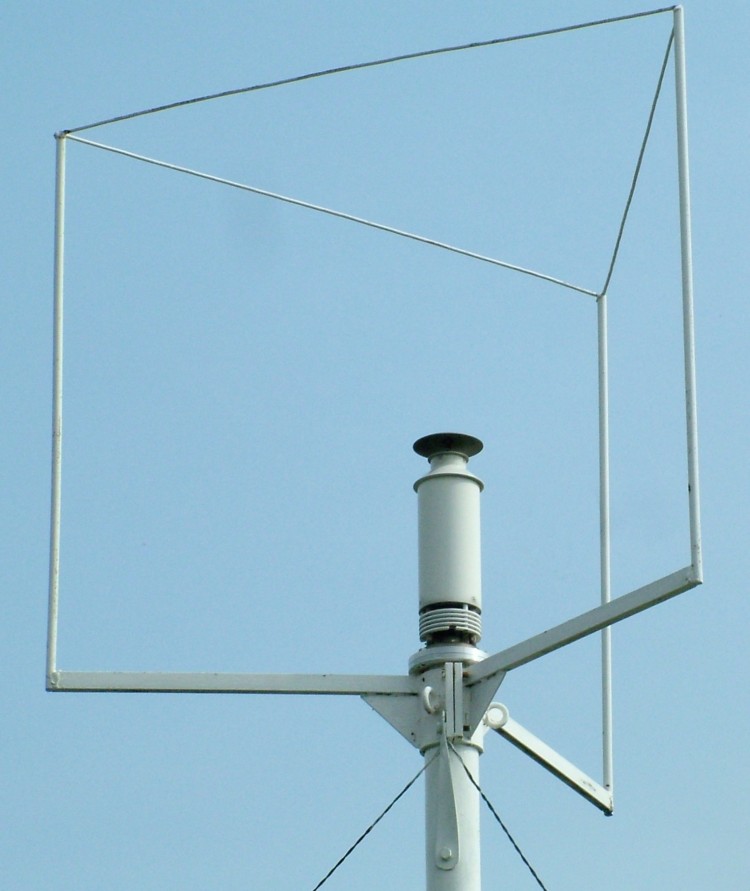
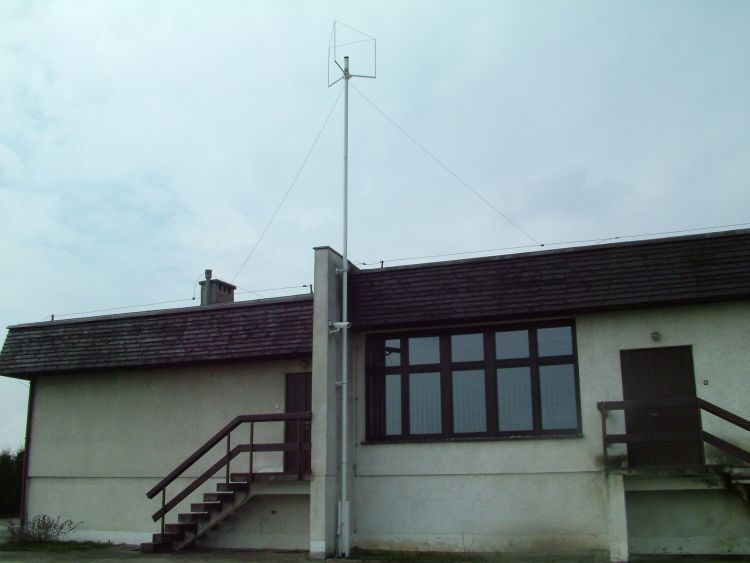
One of possible sources could be the three vertical rods placed
around the station (meant to safeguard it against lightning
discharges). The rods seen from the wind point of view form perfectly
symmetrical structure with respect to the station (thus should not
distort the wind direction) every 30 degrees. Between these 12
directions the structure is assymetrical, thus may distort the air
flow. Most of the peaks of the wavy pattern in the distribution
are separated by just about 30 degrees.
 |
The large number of high values seen in the last of the distributions,
in the relative humidity, is indicative of incorrect measurements of
this quantity. The next
plot shows the fraction of these higher values relative to all
the measurements in each 0.2-year (73-day) division of the period in question.
Here we see evidently systematic rise of the fraction of higher values
in successive years which suggests something wrong is going with this sensor
(a capacitive transducer with thin film, mounted at the bottom of the station).
At the end of 2007 it has produced data of which as many as 93 % were
equal to 100 %. This is more than three times the corresponding percentage
of 2001 and 2002. Apparently, after about two years since our measurements
started, quality of the sensor begun to deteriorate and presently its
data should be considered unreliable.
 |
To find the median and mode we have analysed distributions with up to an
order of magnitude finer resolution than those presented in the preceding section.
Extreme values:
Highest temperature: 37.4 °C on 2007 July 17 at 13:59 UTC
Lowest temperature: -25.5 °C on 2006 January 23 at 6:35 UTC
Highest pressure: 1039.9 hPa on 2006 January 23 at 8:17 UTC
Lowest pressure: 959.1 hPa on 2007 January 19 at 0:02 UTC
Maximum wind speed: 64.0 m/s on 2003 July 18 at 12:20 UTC
| |
Each of the above record values has been checked if it represents a gradually
reached extremum and is not a fake value due to corrupted reading.
This was done by visual inspection of neighbouring measurements in
the respective daily file.
Comparison with Koniczynka station data
In view of suspect quality of some of our measurements we have compared them
with data obtained in a nearby (about 8.5 km away) professional
meteo station
located in Koniczynka village. The station is supervised by dr Marek Kejna of
Department of Climatology,
Institute of Geography, who kindly made his data available to us
(a big thank you to him, and also to Zsuzsa Vizi for help in
data format conversion).
The Koniczynka data taken for comparison were 1-hourly averages in the period
from 1 January 2003 to 31 December 2007, Central European Time. There were
39110 (out of 43824 possible) hours in which
at least one of the five quantities was measured in both the stations.
These were plotted against each other as shown in the figures that follow.
Overlapped points are plotted horizontally offset. The red lines represent
an ideal case of perfect correlation of respective measurements in both
the stations whereas the olive lines correspond to a least squares fit
(see the table further down this page).
 |
 |
 |
 |
 |
The comparisons demonstrate that the first four quantities of the TRAO (Piwnice)
station can be regarded roughly correct. Unfortunately, the fifth one,
the relative humidity looks definitely wrong. There is deficiency of values
below about 20 %, which seem to be systematically shifted to abnormally
high values. On the other hand, the presence of such low values in
the Koniczynka data is also suspect.
Our humidities exceeding 20 % are on average 15 % higher than humidities
in Koniczynka and have excessive scatter (compared to the nominal accuracy
of 3 to 4 percent).
The following table contains numerical results of linear fits. The
best fitted lines are of the form P = a + b*K, where P is
a Piwnice quantity and K - corresponding quantity at the Koniczynka
station. Besides the regression line parameters, a and b
(with their estimation errors),
the table contains also the correlation coefficient R, standard
deviation about the fitted line SD, and number of data used for
the fit N.
 Quantity            a                  b            R       SD     N
Wind speed   2.60677 ± 0.01097  0.44951 ± 0.00276 0.63583 1.31908 39063
Wind dir.*  20.18854   0.3538   0.94018   0.00169 0.94239 33.1683 39063
Temperature  0.76268   0.00761  0.99409   0.00061 0.99282 1.05595 38655
Pressure    -6.09639   0.38556  1.00570   0.00038 0.99724 0.69618 38136
Humidity**  15.05347   0.20228  0.93661   0.00261 0.93226 6.85464 19324
* Fit performed to Piwnice data circularly reduced to the range ±180
degrees about the line
of perfect correlation.
** Fit to Koniczynka humidities greater than 19 %.
|
One notes very good correlation of the air temperature and atmospheric
pressure, and high dispersion of the wind quantities. The Piwnice pressure
is on average lower than that in Koniczynka only by 0.6 hPa
at 960 hPa and by 0.2 hPa at 1040 hPa, while the temperature is higher
by 0.9 to 0.6°C at -25 to +35°C, respectively.
In case of the wind direction, the decorrelation may partly be explained
by inappropriate averaging of data originally read from the station. During
this initial data reduction the angle mean is calculated the same way as
the means of the other quantities.
A proper algorithm should rely on calculating the mean sine and the mean
cosine of the angles being averaged, Di (i = 1, 2, ... N),
and then taking the arctan2 function of the two means or just sums:
<D> = arctan2(Σisin(Di)/N,
Σicos(Di)/N) =
= arctan2(Σisin(Di),
Σicos(Di)),
(1)
where the summations are carried over all N measurements. That is how
our wind direction data were further averaged to obtain the 1-hour means
for this particular plot. Judging after the depth and width of the gap near
the direction of 0° in the angular distribution (see the figure on the left,
which is circularly rearranged and expanded display of a part of the earlier
presented distribution of wind directions) it is possible to estimate the number
of measurements swept away from there. This number makes about 1 %
of all measurements. That many data were affected by the simple
(inappropriate) averaging of angles near 0 and 360°. The data that originally
belonged to the depression at 0° must have been spread over the entire 360°
range, with maximum at 180°.
Corrected and reduced data (downloadable)
The analysis of raw data presented above has indicated the presence
of corrupt recordings. To improve usability of this database an attempt
has been made to clean it of more obvious erratic records and
tag some errors, essentially only with respect to the atmospheric pressure
and temperature measurements. Basic search for errors relied on
comparison of the deviation of each measurement (a 10-second
average as usually stored in the archives) from the mean value
of the temperature and pressure with the standard deviation
calculated for various time intervals. The intervals ranged from 4 minutes
to 1 hour. If a value deviated from the mean by a few standard
deviations it was further compared to neighbouring measurements
and automatically tagged as erratic only if there were 'normal'
neighbours on both sides. There were cases that two consecutive
measurements happened erratic, and these were treated individually.
This way we have detected a few hundred errors, most of them
belonged to the pressure measurements. Another cleaning has been
based on a search for exactly the same numerical values repeated
in number (10 or more) consecutive measurements. It allowed to remove
many cases when apparently all the sensors simultaneously 'froze' for
a few minutes. Such records were not tagged but were altogether
erased from the daily files.
Finally, a search for incorrect time tags was performed. There
are many cases (some 30 000) that two neighbouring records have
the same time stamp (whereas they are expected to differ by 10 s).
About 2700 cases were discovered where time of the next record was
earlier than of the current one, and in 8 files there are backward jumps
in time exceeding 10 minutes and reaching 1 hour (in one case there
is a 2-hour jump!). Unfortunately, only one of the latter cases could
be corrected by shifting in time a portion of earlier data. It seems
that the backward jumps are due to fast computer (internal system)
clock.
The corrected database encompassing measurements till 1 June 2008 (inclusive)
now consists
of 22797080 healthy records (lines) and 347 records tagged as
having erratic pressure or temperature measurement. The summary statistics
do not differ by more than 0.1 from those already presented in this report
and calculated prior to the correction
with sole exception of the median relative humidity, which now is
equal to 99.1 %.
This database has been reduced to 1-hour averages
and is avalable for download in the form of one
zipped file. This big file (uncompressed it is
about 4 MB in size) contains an ASCII table, header plus 65639 data raws,
which begins thus:
                  TCfA Hourly Weather Data
(www.astro.uni.torun.pl/~kb/Reports/Meteo/MeteoSince2000.htm)

  Time      Temperat. Pressure   Humidity  Wind Vel. Dir.  N
  UTC       Mean SD   Mean  SD   Mean  SD  Mean SD   Mean
 [year]       [°C]      [hPa]       [%]      [m/s]    [°]

2000.57508  18.8 0.3 1000.2 0.1  92.5  1.5  5.1 0.7  14.8 204
2000.57519 19.8 0.2 1000.1 0.1 88.1 2.5 5.0 0.9 351.7 354 |
Each data line of this table corresponds to a time interval equal
to 1 hour between
integer UTC hours. Time indicated is given for the center of the interval.
For example, the first line begins with 2000.57508, which signifies the year
2000, and days passed since 0 hours UTC on 1 January: 0.57508*366 =
210.47928, i.e. 211-th day of the year and UTC interval beginning with
the hour equal to the integer of 0.47928*24 = 11.5, i.e. 11:00 UTC.
Note carefully that in the above decoding of time the factor 366
stands for the leap years only (2000, 2004 and 2008); for other years
it is 365.
The next nine columns contain the mean weather quantities
(columns headed 'Mean') with standard deviations
('SD'). The wind direction mean ('Dir') is not
accompanied by SD because of nonstandard averaging (which was angular
averaging according to Eq. (1)).
The rightmost column shows the number
of daily file records used for calculation of the means.
Despite considerable amount of cleaning and corrections, statistical
properties of our data base did not change much, so that the results
presented for original data remain valid. This refers also to the one-hour
data (see this analysis and figures) and to
the correlations with the Koniczynka data, which are now only slightly
better. For example, the most affected quantity of the atmospheric
pressure now is linearly related to
the Koniczynka data through this equation:
PPiwnice =
(-6.43728 ± 0.36735) + (1.00604 ± 0.00037) PKoniczynka,
and this fit has the correlation coefficient of 0.99746 and
standard deviation of 0.66848. In practice, this line is indistinguishable
from the earlier one, as seen from the following figure, wherein
the new fit is represented by the thin light line drawn in the middle
of the other. Comparing this diagram with that
for uncorrected data one easily notes disappearence of many outliers.
Recommended actions to take
Since the humidity sensor produces strongly biased data, it would
be advisable to return the station to the manufacturer for refurbishment
and upgrade of the firmware.
Take off or rotate the shielding 'cage' built around the station
to see if the wavy pattern in the wind angular
distribution disappears or rotates in response.
The external data acquisition software (a product of TCfA, written by
E. Pazderski) should be amended
to perform the initial averaging of the wind direction data according to
Eq. (1).
The angular averaging has been implemented on 5 June 2008.
The recorded station built-in test results (such as '0 0xff') should
include information on the presence of any occurence of erratic
measurement among those averaged, and not be just taken from the last
message.
Since June 06, 2008 the stamp '0xff' is there
only if ALL the averaged records are without any error related to
the meteo data as acquired from the station.
Investigate why so many time data in neighbouring measurements
are the same or reversed (later record has earlier time ascribed). This could
be also related to our data acquisition software.
The daily data files should be moved to another directory as soon
as they are closed. In the future this would prevent accidental appending
of data that belong to another file in case the system time/date jumps.
The system time should be synchronised to the UTC more frequently (probably
once a day would be more than adequate), to avoid excessive errors
in the time data.
|